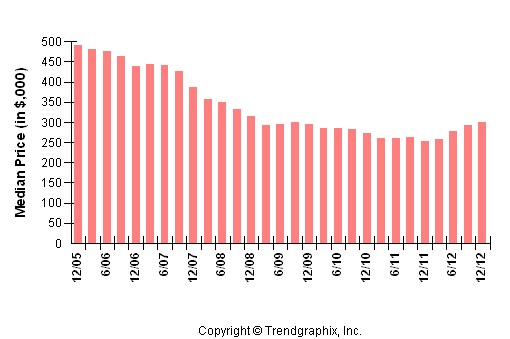
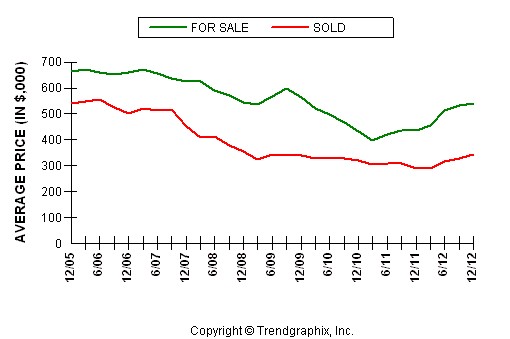
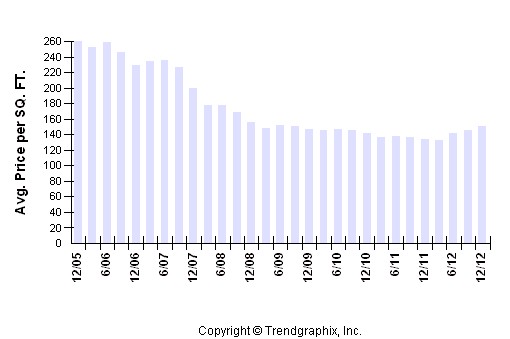
2012 was an incredible year for home prices in Placer County. After seeing prices drop month after month, quarter after quarter and year after year over the past 7 years, things finally turned around and started an upward trend in 2012.
Between December 2011 and December 2012, in Metrolist MLS, the median sales price of single family homes in Placer County increased 18.6%, while the average price increased 18.7% and the average price per square-foot rose 13.3%.
Over the past 7 years we have still seen a 38.8% decline in the median price, 36.7% decline in the average price and 41.7% decline in the average price per square-foot, but the bottom had to be reached at some point, and at least for now it appears that it was reached at the end of 2011.
Here are some graphs to provided by www.trendgraphix.com to help illustrate the price changes over the past five years.

| 1 quarter | 1 year | 7 years | |||||||
| Sep 12 | Dec 12 | % Change | Dec 11 | Dec 12 | % Change | Dec 05 | Dec 12 | % Change | |
| Median Price | 293 | 300 | 2.4% |
253 | 300 | 18.6% |
490 | 300 | -38.8% |

| 1 quarter | 1 year | 7 years | |||||||
| Sep 12 | Dec 12 | % Change | Dec 11 | Dec 12 | % Change | Dec 05 | Dec 12 | % Change | |
| Avg. Active Price | 533 | 539 | 1.1% |
438 | 539 | 23.1% |
663 | 539 | -18.7% |
| Avg. Sold Price | 328 | 343 | 4.6% |
289 | 343 | 18.7% |
542 | 343 | -36.7% |

| 1 quarter | 1 year | 7 years | |||||||
| Sep 12 | Dec 12 | % Change | Dec 11 | Dec 12 | % Change | Dec 05 | Dec 12 | % Change | |
| Avg. Sq. Ft. Price | 146 | 151 | 4% |
134 | 151 | 13.3% |
260 | 151 | -41.7% |

Leave A Comment